Coup attempts, even if they fail, as the events in Turkey since July 2016 have shown, can have a major impact on a country. And, as some of the reactions to the Turkey coup attempt have reiterated, they often seem to come as a surprise. We have created coup forecasts for 161 countries for 2017 that should make it more obvious and less surprising where any coup attempts that might happen this year will occur. Aside to presenting those forecasts, this post goes into a little bit more technical detail on how they were created.

First, this project is very much inspired by and in may ways a continuation of Jay Ulfelder’s coup forecasts for 2012-2015 (2012, 2013, 2014, 2015). It also draws on previous work Mike Ward, Cassy Dorff, and I have done on forecasting irregular leadership changes, which include coups, but also other mechanisms of sudden leader change.

Forecasts

coup-fcast-map-2017-v2

Read More

Over the past few months we have worked on regularly updating our irregular leadership change models and forecasts in order to provide monthly 6-month ahead forecasts of the probability of irregular leadership change in a large number of countries–but excluding the US–worldwide. Part of that effort has been the occasional glance back at our previous predictions, and particularly more in-depth examinations for notable cases that we missed or got right, to see whether we can improve our modeling as a result. This note is one of these glances back: a postmortem of our Yemen predictions for the first half of 2015.

To provide some background, the ILC forecasts are generated from an ensemble of seven thematic1 split-population duration models. For more details on how this works or what irregular leadership changes are and how we code them, take a look at our R&P paper or this longer arXiv writeup.

We made a couple of changes this year, notably adding data for the 1990’s, which in turn cascaded into more changes because of the variation in ICEWS event data volume. This delayed things a bit, but eventually we were able to generate new forecasts for the time period from January to June 2015, using data up to December 2014. Here were the top predictions:

Country 6-month Prob.
Burkina Faso 0.058
Egypt 0.055
Ukraine 0.044
India 0.038
Somalia 0.038
Afghanistan 0.035
Nigeria 0.030

Read More

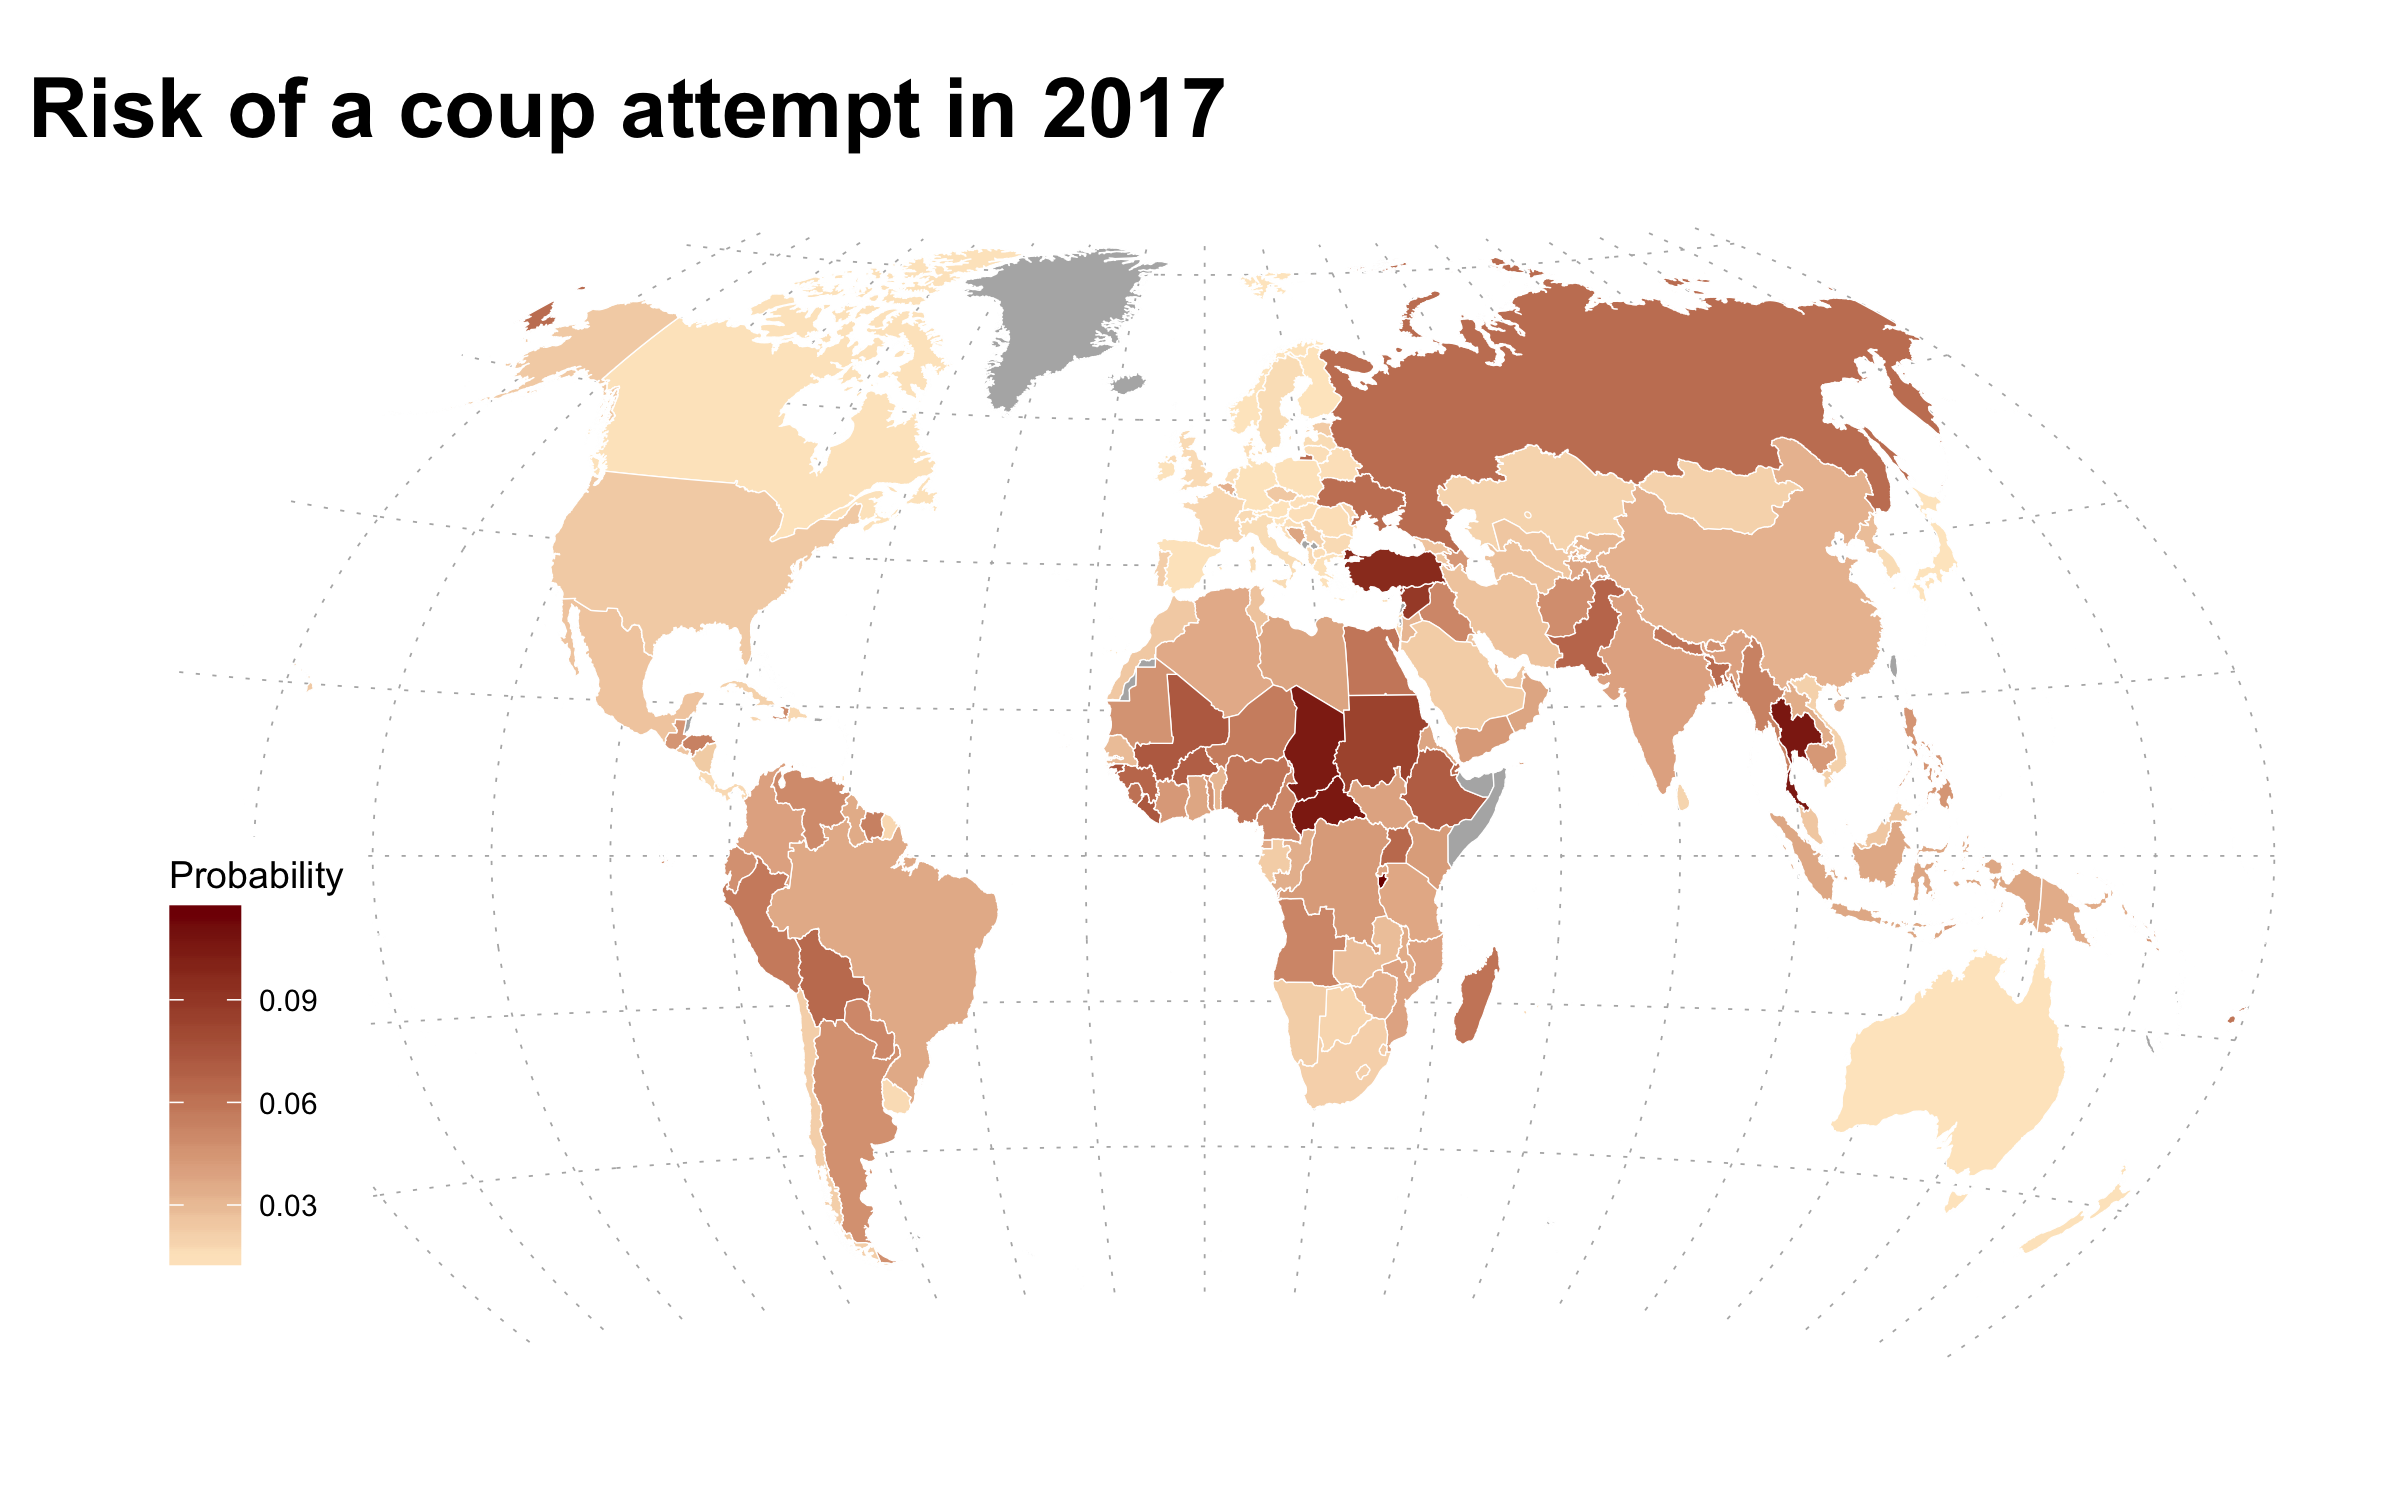
Alexander Noyes and Sebastian Elischer wrote about good coups on Monkey Cage a few weeks ago, in the shadow of fallout from the LaCour revelations. Good coups namely are those that lead to democratization, rather than outcomes one might more commonly associate with coups, like military rule, dictatorship, or instability. Elischer, although on the whole less optimistic about good coups than Noyes, writes:

There is some good news for those who want to believe in “good coups.” A number of military interventions in Africa have led to competitive multiparty elections, creating a necessary condition for successful democratization. These cases include the often (perhaps too often)-cited Malian coup of 1991, the Lesotho coup of 1991, the Nigerien coups of 1999 and 2000, the Guinean coup of 2008, the Malian coup of 2012 and potentially Burkina Faso’s 2014 coup, among others.

Here is a quick look at the larger picture. I took the same Powell and Thyne data on coups that is referenced in the blog posts and added the Polity data on regimes to it.1 Specifically, I added the Polity score 7 days before a coup, and 1 and 2 years afterwards, although I’ll focus on the changes 2 years later. The Polity score measures, on a scale from -10 to 10, how autocratic or democratic a regime is. The scale is in turn based on a larger number of items coded by the Polity project. It’s not quite an ordinal or interval scale, in part because there are a couple of special codes for regimes that are in transition or where a country is occupied or without a national government (failed state). Rather than exclude these special scores or convert them to Polity scores, I grouped the Polity scores into several broader categories from autocracy to full democracy, and kept the special codes under the label “unstable”, which may or may not be a good description for them.

The overwhelming pattern for all 227 successful coups that the data cover is that things stay the same (0.41 of cases) or get worse (0.40 of cases). The plot below shows the number of times specific category-to-category switches took place, with the regime 7 days before a successful coup on the y-axis, and the regime 2 years later on the x-axis. It’s really just a slightly more fancy version of a transition matrix.2

2-year-transitions-ssa-90on

Read More

The current data situation on the Web

The current data situation on the Web. Not pictured: landing net R. Image from commons.wikimedia.org

This is a guest post by Simon Munzert, PhD student at the University of Konstanz, who is currently on a visit at the Lab.

It’s not that the people here at Duke’s Department of Political Science—and the WardLab members in particular—risk to run out of hot data in the near future. As somebody who is primarily concerned with research on public opinion and election forecasting, I was stunned in view of the masses of high quality event data and its potential for so many applications. Still, during my short stay at the Lab as a visiting scholar I had the opportunity to give a little introduction to various web scraping techniques using R.

Why web scraping? We have observed that the rapid growth of the World Wide Web over the past two decades tremendously changed the way we share, collect and publish data. Firms, public institutions and private users provide every imaginable type of information and new channels of communication generate vast amounts of data on human behavior. As many data on the Web are products of social interaction, they are of immediate interest for us as social scientists. Over the past years research on computer-based methods for classification and analysis of existing large amounts of data is booming across all disciplines, and political scientists contribute heavily to this process.

Read More

or, How I learned to stop worrying and love event data. 

Nobody in their right mind would think that the chances of civil war in Denmark and Mauritania are the same. One is a well-established democracy with a GDP of $38,000 per person and which ranks in the top 10 by Human Development Index (HDI), while the other is a fledgling republic in which the current President gained power through a military coup, with a GDP of $2,000 per person and near the bottom of the HDI rankings. A lot of existing models of civil war do a good job at separating such countries on the basis of structural factors like those in this example: regime type, wealth, ethnic diversity, military spending. Ditto for similar structural models of other expressions of political conflict, like coups and insurgencies. What they fail to do well is to predict the timing of civil wars, insurgencies, etc. in places like Mauritania that we know are at risk because of their structural characteristics. And this gets worse as you leave the conventional country-year paradigm and try to predict over shorter time periods.

The reason for this is obvious when you consider the underlying variance structure. First, to predict something that changes, say dissident-government conflict, the nature of relationships between political parties, or political conflict, you need predictors that change.

thailand

Predictions for regime change in Thailand from a model based on reports of government-dissident interactions (top). White noise, with intrinsically high variance, is not helpful (middle), but neither is GDP per capita (bottom).

Read More

During a compelling class on criminal organizations taught by Guillermo Trejo, at Duke University, I was struck by the complex consequences of criminal–and political–violence on civilian life. At the same time, I was enrolled in a course on social networks with Jim Moody, a wonderfully talented sociologist who convincingly situates network dynamics at the center of the human experience. By the end of the semester I was left with the question: how do networks moderate the effects of violence on civilian life? This question eventually led me to co-organize a national survey in Mexico in July 2012, with my colleague Sandra Ley Gutierrez, focusing on the consequences of criminal victimization. In this survey, I collected original data on 1,000 kinship networks as a way to capture social networks at the individual level.

Studies on victimization have repeatedly reported that victimization is associated with an increase in political participation, but we don’t really understand why. I find that for self-identified victims, kinship connectiveness increases probability of participation in political party meetings by 5%, all else constant (when the other covariate values from my model are set at their mean or median). The size of this result is consistent with other studies on political participation which typically find effects under the 10% range. These predicted probabilities, of course, are contingent on the selected covariate values. Thus, let’s also review specific “real world” scenarios.

Read More

实验室文章:迈向冲突预测的新时代

Journal Article , 2013

文章摘要

在冲突研究的领域中,虽然预测分析的重要性不言可喻,但是却一直没有受到足够的重视。我们认为,预测不仅具有实质公共政策参考的能力,另一方面也能用来检证既有理论模型、避免统计上过度配适(overfitting)且降低确认误差(confirmation bias),藉以建构出更可靠的冲突预测。在本篇文章中,我们回顾了学界在冲突预测研究中有哪些进展,发现由于这五十年来学科在资料搜集和运算能力的进步下,研究者得以从事过去所难以企及的预测研究工作,尤其在自动化的编码程序辅助下,快速的搜集数字化的新闻讯息成为可能,冲突研究得以应用以每日、每周、每月为单位的事件解析数据(disaggregated event data)来进行国家层次以下,有关政府与反抗团体的个体活动资料进行及时性的冲突预测工作。

为了呈现冲突研究在过去几年的重大进展,本文重新检视Fearon and Laitin (2003)这份奠定冲突研究基础的文献,从而比较和凸显预测分析在近几年的进展。结果发现,虽然Fearon and Laitin的研究中有很多的解释变量具有统计上的显著性,但是模型对于样本外事件的预测精确度却不高,这因为利用观察型的资料建构出具有统计上显著变量的模型,并无法回答像是何时、何处会发生内战这种决策者所关注的预测问题。

Read More

Mining Texts to Generate Fuzzy Measures of Political Regime Type at Low Cost.  Reposted from Dart Throwing Chimp, by Jay Ulfelder.

Political scientists use the term “regime type” to refer to the formal and informal structure of a country’s government. Of course, “government” entails a lot of things, so discussions of regime type focus more specifically on how rulers are selected and how their authority is organized and exercised. The chief distinction in contemporary work on regime type is between democracies and non-democracies, but there’s some really good work on variations of non-democracy as well (see here and here, for example).

Unfortunately, measuring regime type is hard, and conventional measures of regime type suffer from one or two crucial drawbacks.

Read More

This post was written by Jay Ulfelder and originally appeared on Dart-Throwing Chimp. The work it describes is part of the NSF-funded MADCOW project to automate the coding of common political science datasets.

Guess what? Text mining isn’t push-button, data-making magic, either. As Phil Schrodt likes to say, there is no Data Fairy.

I’m quickly learning this point from my first real foray into text mining. Under a grant from the National Science Foundation, I’m working with Phil Schrodt and Mike Ward to use these techniques to develop new measures of several things, including national political regime type.

I wish I could say that I’m doing the programming for this task, but I’m not there yet. For the regime-data project, the heavy lifting is being done by Shahryar Minhas, a sharp and able Ph.D. student in political science at Duke University, where Mike leads the WardLab. Shahryar and I are scheduled to present preliminary results from this project at the upcoming Annual Meeting of the American Political Science Association in Washington, DC (see here for details).

When we started work on the project, I imagined a relatively simple and mostly automatic process running from location and ingestion of the relevant texts to data extraction, model training, and, finally, data production. Now that we’re actually doing it, though, I’m finding that, as always, the devil is in the details. Here are just a few of the difficulties and decision points we’ve had to confront so far.

Read More

Improvised explosive devices, or IEDs, were extensively used during the US wars in Iraq and Afghanistan, causing half of all US and coalition casualties despite increasingly sophisticated countermeasures. Although both of these wars have come to a close, it is unlikely that the threat of IEDs will disappear. If anything, their success implies that US and European forces are more likely to face them in similar future conflicts. As a result there is value in understanding the process by which they are employed, and being able to predict where and when they will be used. This is a goal we have been working on for some time now as part of a project funded by the Office of Naval Research, using SIGACT event data on IEDs and other forms of violence in Afghanistan.

expl-haz

Explosive hazards, which include IEDs, for our SIGACT data.

Read More