Alexander Noyes and Sebastian Elischer wrote about good coups on Monkey Cage a few weeks ago, in the shadow of fallout from the LaCour revelations. Good coups namely are those that lead to democratization, rather than outcomes one might more commonly associate with coups, like military rule, dictatorship, or instability. Elischer, although on the whole less optimistic about good coups than Noyes, writes:
There is some good news for those who want to believe in “good coups.” A number of military interventions in Africa have led to competitive multiparty elections, creating a necessary condition for successful democratization. These cases include the often (perhaps too often)-cited Malian coup of 1991, the Lesotho coup of 1991, the Nigerien coups of 1999 and 2000, the Guinean coup of 2008, the Malian coup of 2012 and potentially Burkina Faso’s 2014 coup, among others.
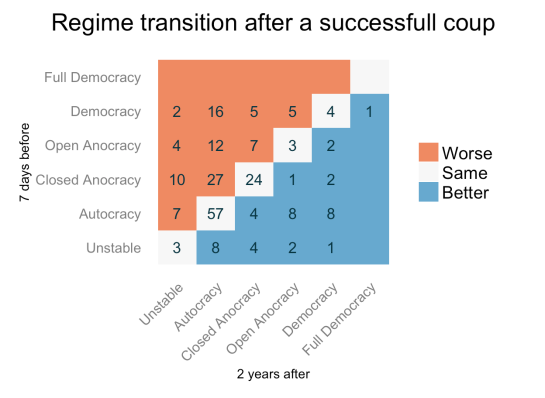
Here is a quick look at the larger picture. I took the same Powell and Thyne data on coups that is referenced in the blog posts and added the Polity data on regimes to it.1 Specifically, I added the Polity score 7 days before a coup, and 1 and 2 years afterwards, although I’ll focus on the changes 2 years later. The Polity score measures, on a scale from -10 to 10, how autocratic or democratic a regime is. The scale is in turn based on a larger number of items coded by the Polity project. It’s not quite an ordinal or interval scale, in part because there are a couple of special codes for regimes that are in transition or where a country is occupied or without a national government (failed state). Rather than exclude these special scores or convert them to Polity scores, I grouped the Polity scores into several broader categories from autocracy to full democracy, and kept the special codes under the label “unstable”, which may or may not be a good description for them.
The overwhelming pattern for all 227 successful coups that the data cover is that things stay the same (0.41 of cases) or get worse (0.40 of cases). The plot below shows the number of times specific category-to-category switches took place, with the regime 7 days before a successful coup on the y-axis, and the regime 2 years later on the x-axis. It’s really just a slightly more fancy version of a transition matrix.2

Read More

